


Retail Audits in Nigeria: How FMCG Brands Measure Distribution, Shelf Share and Stock-Outs
A brand manager in Lagos signs off a big trade promotion. The depot ships record volume. Six weeks later, sales flatten and the distributor asks for credit. Nobody can say where the product went, which shops stocked it, or whether it ever reached the shelf at the right price.
This is the gap a retail audit closes. A retail audit sends trained field staff into a fixed sample of shops, kiosks, supermarkets and open market stalls to record what is on the shelf, at what price, in what quantity and next to which competitors. It measures what happens after the product leaves your warehouse.
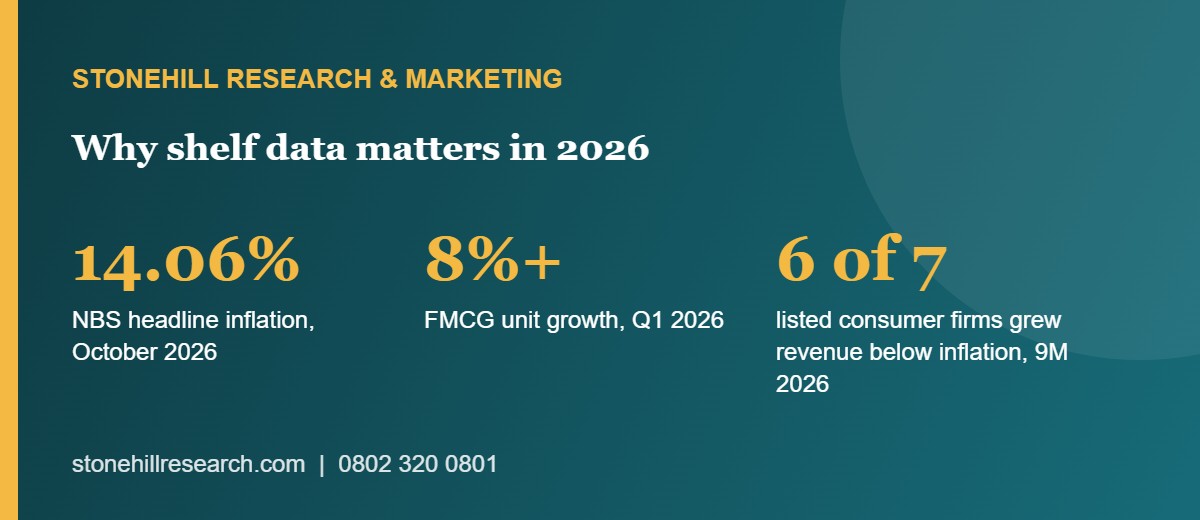
The need is sharper in 2026. NBS reported headline inflation of 14.06% for October 2026, with food inflation at 19.13%. Worldpanel by Numerator found that Nigerian FMCG unit growth passed 8% in the first quarter of 2026 while value growth stayed under 1%. Shoppers are buying again, but they are trading across brands and pack sizes. The brand that is present, visible and fairly priced in the right outlets wins those trips.
This guide explains how retail audits work in Nigeria, which metrics matter, how to design one that your sales team will trust, and how to turn the numbers into decisions.
What a retail audit measures
A retail audit records facts at the point of sale. It does not ask shoppers what they think. It counts what is there. That makes it one of the most objective tools in market research.
A standard Nigerian retail audit captures these data points in each outlet visited:
- Presence: is the brand and each SKU stocked today?
- Stock-out: was the SKU stocked on the last visit but absent now?
- Shelf facings: how many front-facing units does each brand hold?
- Price: the actual selling price per unit, compared with the recommended retail price
- Stock on hand: units on the shelf and in the back store
- Purchases and sales: where the trader keeps records, units bought and sold since the last visit
- Point-of-sale material: posters, branded racks, coolers and their condition
- Freshness: batch codes and expiry dates on perishable lines
- Source of supply: distributor, wholesaler, open market or company van
Each data point answers a commercial question. Presence tells you about reach. Facings tell you about visibility. Price tells you whether margin is leaking along the chain. Source of supply tells you whether your distributor structure works or whether traders are buying from the open market at Idumota, Onitsha Main Market or Kano’s Singer Market.
The core metrics and how to calculate them
Retail audits produce a small set of standard measures. Your sales director, finance team and distributors need to agree on the definitions before fieldwork starts.
| Metric | What it measures | How it is calculated |
|---|---|---|
| Numeric distribution | Reach across outlets | Outlets stocking the SKU divided by all outlets in the universe, as a percentage |
| Weighted distribution | Reach weighted by outlet importance | Category sales of stocking outlets divided by total category sales, as a percentage |
| Out-of-stock rate | Availability failures | Outlets that normally carry the SKU but have none today, divided by outlets that normally carry it |
| Share of shelf | Visibility against competitors | Your facings divided by total category facings |
| Price compliance | Pricing discipline | Outlets selling within an agreed band of the recommended price, divided by outlets stocking |
| Market share (audit-based) | Sales position | Your unit or value sales divided by total category sales in audited outlets |
The gap between numeric and weighted distribution tells a story. Suppose your numeric distribution is 40% and your weighted distribution is 70%. You are in fewer shops, but they are the big ones. Now reverse it. A numeric distribution of 70% with weighted distribution of 40% means you are in many small kiosks but missing the high-traffic outlets that move category volume.
Why the Nigerian retail landscape needs its own approach
Retail audit methods were built for markets dominated by supermarket chains with scanner data. Nigeria works differently. Most FMCG volume moves through traditional trade: neighbourhood kiosks, table-top sellers, roadside shops, open market stalls and wholesalers who also sell to consumers.
That changes how you design the study.
There is no ready-made outlet list. In many Nigerian cities no complete census of retail outlets exists. A serious audit starts with an outlet census or a mapped sample of enumeration areas. Field teams walk defined areas, record every outlet with GPS coordinates and classify each one by type and size.
Records are thin. Many traders do not keep purchase or sales books. Auditors must rely on stock counts at each visit plus invoices where available. Sales are then estimated as opening stock plus purchases minus closing stock.
Wholesale and retail overlap. A shop in Mushin may sell single sachets to consumers and cartons to smaller retailers. Your classification must capture this, or you will double count volume.
Prices move fast. With month-on-month headline inflation at 0.43% in October 2026, prices in fast-moving categories can shift between visits. Auditors should record the price at the time of the visit, not the price the trader remembers.
Geography matters. A sample built only in Lagos and Abuja will mislead a brand with national ambitions. Kano, Onitsha, Aba, Ibadan and Port Harcourt each have distinct trade structures and supply routes.
How 2026 market conditions raise the stakes
Listed consumer companies are spending more to push product through the trade, and the results are mixed. A Nairametrics review of nine-month 2026 results found that six of seven listed consumer goods companies grew revenue more slowly than inflation, which points to falling real volumes. Distribution expenses rose 29% at Nigerian Breweries and 20% at Guinness Nigeria. Cadbury Nigeria’s selling and distribution costs more than doubled to N20 billion. Nestlé Nigeria raised consumer promotion spending by 64% to N60.8 billion.
When distribution and promotion budgets grow this fast, boards will ask what they are buying. A retail audit gives the answer in measurable terms: more outlets stocked, fewer stock-outs, better shelf position and tighter price discipline. Without one, you see only shipments to distributors, which can rise while consumer offtake falls.
Credit is another warning sign. BusinessDay reported that credit sales by listed FMCG firms reached N325.2 billion in the first half of 2025, up 55.4% from a year earlier. Product sold on credit to distributors is not the same as product sold to shoppers. Audit data shows whether stock is moving off shelves or piling up in the chain.
Designing a retail audit that works
A good audit starts with the decision it must support. Write that decision down before you design anything else. Examples include whether to appoint a new distributor in the North-West, whether a price increase is holding at retail, or whether a new SKU has reached its distribution target.
Then follow these steps.
- Define the universe. Decide which outlet types count: supermarkets, provision stores, kiosks, open market stalls, pharmacies, bars or chemists. Set the geography by state, city and area.
- Build the outlet frame. Run a census in selected enumeration areas or use a recent mapped list. Record outlet type, size, location and categories sold.
- Draw a stratified sample. Split outlets by region, type and size. Sample enough outlets in each cell to produce stable estimates. A typical first wave covers 300 to 1,500 outlets, depending on the number of regions and outlet types.
- Fix the panel. Visit the same outlets wave after wave. A fixed panel gives you clean trends. Replace closed outlets with similar ones from the same cell.
- Set the visit cycle. Monthly visits suit most FMCG categories. Bi-monthly visits can work for slower categories such as household durables.
- Design the questionnaire. Keep it short. Use photo capture of shelves, barcode scans and GPS stamps on every visit.
- Train and test. Run a pilot in 20 to 40 outlets. Fix confusing questions and check timing per visit.
- Quality control. Back-check at least 10% of visits by phone or revisit. Compare photos against recorded facings. Flag outlier prices automatically.
- Weight and report. Weight results to the outlet universe. Report numeric and weighted distribution, stock-outs, share of shelf and price, by region and outlet type.
Technology that improves accuracy
Digital data collection has changed retail audits in Nigeria. Field staff now use tablets or smartphones with offline-capable survey software. Each visit records GPS coordinates, a timestamp and shelf photos. These features make fabricated visits much harder and give clients visual evidence.
Image recognition software can count facings from shelf photos, though results still need human checking in crowded open market stalls where products are stacked loosely. Barcode scanning reduces SKU errors. Dashboards built on the cleaned data let regional sales managers see their own territory within days of fieldwork closing.
Technology does not replace field discipline. A poorly trained auditor with a tablet produces bad data faster. Training, supervision and back-checks remain the foundation.
From numbers to decisions
Audit data earns its cost only when it changes what the business does. Here is how leading teams use it.
Fix distribution gaps. Map outlets where the category sells but your brand is absent. Send this list to distributors and van sales teams as a target list with outlet names and GPS points.
Cut stock-outs. High out-of-stock rates in outlets that normally carry your brand point to replenishment problems. Check order frequency, distributor credit limits and depot stock levels.
Protect price. If audits show your 50cl drink selling well above the recommended price in Kano but at it in Lagos, margin is being captured in the chain. Review distributor margins and transport costs on that route.
Measure promotions. Run an audit wave before a trade promotion and another during and after it. Compare distribution, facings and offtake. This separates real consumer pull from stock loading.
Track competitors. Audit data shows when a rival launches a new pack size, cuts price or gains shelf space. You see it in weeks, not quarters.
Judge distributors fairly. Compare distributors on outlet coverage, stock-outs and price compliance in their territories. Volume shipped alone rewards stock loading.
Worked example
This example is illustrative and uses invented figures to show the method.
A mid-sized seasoning brand sells in Lagos, Ibadan, Kano and Onitsha. Shipments to distributors grew 12% year on year, but the marketing team suspects shoppers are not seeing the product. The company commissions a three-wave monthly retail audit across 600 outlets: 200 in Lagos, 120 in Ibadan, 160 in Kano and 120 in Onitsha.
Wave one results:
| City | Numeric distribution | Weighted distribution | Out-of-stock rate | Share of shelf |
|---|---|---|---|---|
| Lagos | 62% | 78% | 9% | 21% |
| Ibadan | 55% | 64% | 14% | 17% |
| Kano | 31% | 38% | 22% | 9% |
| Onitsha | 48% | 71% | 11% | 19% |
The findings are clear. Kano is the weak market on every measure. Onitsha has low numeric but high weighted distribution, which means the brand sits in the large wholesale-retail outlets but misses small neighbourhood shops supplied from them.
The source-of-supply question shows that 58% of Kano outlets stocking the brand bought it from the open market, not from the appointed distributor. The distributor was selling in bulk to wholesalers and leaving retail coverage to chance.
The company acts on three fronts. It appoints a second distributor in Kano with a retail coverage target. It runs a small-pack push in Onitsha neighbourhood shops. It tightens the replenishment cycle in Ibadan, where stock-outs were high.
By wave three, Kano numeric distribution rises to 39% and its out-of-stock rate falls to 15%. The team now reports progress to the board in outlet terms, not just shipment terms.
Common mistakes to avoid
- Auditing only modern trade. Supermarkets are easy to visit but carry a small part of FMCG volume in most Nigerian categories. Leaving out kiosks and open markets gives a flattering and false picture.
- Changing the panel every wave. New outlets each month make trends meaningless. Keep a fixed panel and replace only closed outlets.
- Confusing numeric with weighted distribution. Report both. A rise in numeric distribution in tiny outlets may add little volume.
- Skipping the outlet census. Without a proper frame, you cannot weight results to the market, and your share estimates drift.
- Weak field quality control. No back-checks, no photos and no GPS stamps invite fabricated data.
- Collecting data nobody uses. A 40-minute questionnaire tires traders and auditors. Keep only questions linked to decisions.
- Reporting late. Results that arrive two months after fieldwork cannot guide this month’s sales plan. Aim for reports within 10 working days of fieldwork close.
- Ignoring trader goodwill. Traders give their time for free. Brief them, keep visits short and thank them. Refusal rates rise fast when auditors are rude or slow.
Frequently asked questions
What is the difference between a retail audit and a consumer survey?
A retail audit counts what is in the shop: stock, price, facings and sales. A consumer survey asks people about their awareness, preferences and buying habits. The audit tells you whether your product is available and visible. The survey tells you why shoppers choose it or not. Most brands need both.
How many outlets should a retail audit cover in Nigeria?
It depends on the number of regions and outlet types you want to report on. A single-city study can work with 200 to 300 outlets. A national study covering several states and outlet types often needs 1,000 or more. Each reporting cell needs enough outlets to give stable results.
How often should we run a retail audit?
Monthly waves suit most food, beverage and personal care categories because prices and stock levels change quickly. Bi-monthly or quarterly waves can work for slower categories. Run extra waves around major launches and promotions.
Can a retail audit measure market share without scanner data?
Yes. Auditors count opening stock, purchases and closing stock at each visit to estimate sales per outlet. Weighting those sales to the outlet universe gives an estimate of brand share. Accuracy depends on a good outlet frame and consistent field methods.
How long does it take to set up a retail audit?
A typical set-up takes four to eight weeks. That covers defining the universe, running the outlet census, drawing the sample, building the questionnaire, training field staff and piloting. Later waves run on a fixed monthly cycle.
Work with Stonehill Research
Stonehill Research & Marketing designs and runs retail audits, distribution checks and shelf studies for FMCG, pharmaceutical and beverage brands across Nigeria. Our field teams cover major cities and secondary towns, with GPS-verified visits, shelf photos and back-checks on every wave. We turn the data into clear dashboards and action lists for your sales and distribution teams.
Explore our market research services, our data collection and surveys capability, our competitor analysis work and our data visualisation service.
To plan your retail audit, call 0802 320 0801 or 0807 576 5799, email info@stonehillresearch.com, or visit stonehillresearch.com/contact-us.
Sources: NBS October 2026 inflation, reported by Blueprint, Worldpanel by Numerator Q1 2026 Nigeria FMCG insight, Nairametrics review of nine-month 2026 results.
This article is general information on research practice. The worked example uses illustrative figures. Speak to a research professional before you commit budget to a study design.