


Promotion Effectiveness Research in Nigeria: Is Your Promotional Spend Working?
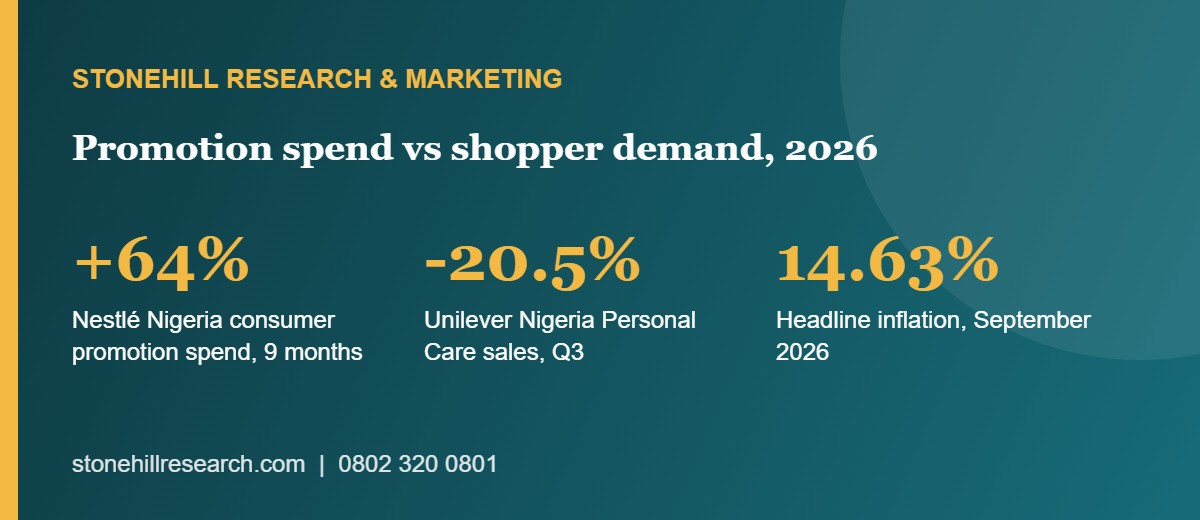
Nigerian consumer companies are spending heavily to hold on to shoppers. Nestlé Nigeria’s consumer promotions rose 64% to ₦60.8 billion in the first nine months of 2026, according to Nairametrics. Revenue rose 10.4%. Across the sector, profits grew while shoppers bought less.
That raises a simple question every brand manager should be able to answer. Which of those promotions created new sales, and which simply discounted sales the company would have made anyway?
Most Nigerian companies cannot answer it with evidence. This article explains why it matters now, what good promotion research looks like, how to run it in the Nigerian market, and how to work out whether a promotion made or lost money.
Why the question matters more in 2027
Shoppers are under pressure. Inflation fell to 14.63% in September 2026, the lowest since 2020, but prices are still rising and incomes have not kept up. Unilever Nigeria said consumer demand came under pressure in the third quarter. Its Personal Care sales fell 20.5% in that quarter while Foods grew 27.2%, according to Nairametrics’ review of its results. Households are protecting essentials and cutting elsewhere.
Price increases are running out of room. Much of 2026’s profit growth came from higher prices and cheaper finance. Only a few consumer companies grew sales faster than inflation. In 2027 brands will lean harder on promotions to protect volume.
Boards will ask for proof. When promotional spend grows by more than half in a year, finance directors and boards want to see the return. A promotion budget without evidence is the easiest line to cut.
What promotions can and cannot do
A promotion can do four things:
- Bring in new buyers who try the brand and may return.
- Increase frequency or quantity among existing buyers.
- Win share from competitors during the promotion window.
- Bring purchases forward, so sales rise now and fall later.
Only the first three create value. The fourth often costs margin for no lasting gain. Research has to separate them.
Promotion types compared
Different mechanics attract different shoppers. Choose the mechanic to fit the objective, then measure against that objective.
| Mechanic | Best for | Main risk | What to measure |
|---|---|---|---|
| Price discount | Short-term volume, competitive response | Trains shoppers to wait for discounts | Incremental units, post-promotion dip |
| Bonus pack or extra quantity | Rewarding loyal buyers, defending share | Subsidises buyers who would buy anyway | Share of new versus existing buyers |
| Free sample or trial pack | New product launch, new buyers | Trial without repeat | Repeat purchase within 8 weeks |
| Gift with purchase | Building excitement, trade engagement | High cost, gift leakage | Redemption rate, cost per buyer |
| Trade incentive to retailers | Distribution, display, shelf space | Incentive kept by the trade | Display compliance, sell-out |
| Raffle or instant win | Awareness and footfall | Regulatory compliance, low incrementality | Participation, incremental sales |
Raffles and instant-win promotions in Nigeria may require approval from the relevant lottery or consumer protection regulators. Check requirements before launch.
The five questions good research answers
- Incremental volume: How many extra units sold because of the promotion, compared with what would have sold without it?
- Source of volume: Did buyers come from competitors, from other pack sizes of the same brand, or from future purchases?
- Who responded: New buyers, lapsed buyers or loyal regulars?
- After-effect: Did sales dip after the promotion ended, and for how long?
- Trade compliance: Did retailers and distributors pass the price or offer to shoppers?
The fifth question is often ignored in Nigeria, and it matters a great deal. A promotion funded by the brand but not passed on by the trade delivers nothing to the shopper.
Research methods that work in Nigeria
Nigeria’s retail landscape is mixed: open markets, neighbourhood kiosks, modern supermarkets and growing online channels. No single method covers it all. A practical programme combines several.
Test and control areas. Run the promotion in some areas and not in comparable others. Compare sales. This is the cleanest way to measure incremental volume.
Retail audits. Visit a sample of outlets before, during and after the promotion. Record stock, price, display and whether the offer is visible. This measures trade compliance and availability.
Shopper intercepts. Speak to shoppers at the point of purchase. Ask what they bought, what they would have bought otherwise and whether the offer influenced them. This reveals the source of volume. Our consumer surveys team runs intercepts across Lagos, Abuja, Kano and Port Harcourt.
Distributor and sell-out data. Where available, match shipments to sell-out. A spike in shipments without a spike in sell-out signals channel stuffing.
Consumer tracking. Track awareness, trial and repeat purchase among a consistent sample over time. This shows whether new buyers stay.
Mystery shopping. Trained shoppers check whether staff apply promotions correctly and whether shelf prices match the offer.
Designing a test and control study, step by step
- Set the objective in numbers. For example, 15% more units in four weeks with no more than a 5% dip afterwards.
- Pick matched areas. Choose test and control areas with similar income levels, outlet mix and recent sales trends. Two or three matched pairs give more reliable results than one.
- Measure a baseline. Record at least four weeks of sales before launch in both areas.
- Run the promotion in the test areas only. Keep pricing, distribution and advertising otherwise the same.
- Audit compliance in week one. Fix gaps quickly, and record them so the analysis can adjust for them.
- Measure four to six weeks after the end. This captures the dip and any repeat purchase.
- Report the net result. Incremental units minus the dip, set against the full cost.
A worked example: did the promotion pay?
A brand runs a ₦20 discount on a ₦250 pack for four weeks in Lagos test areas. Unit gross margin before the promotion is ₦60.
- Baseline: 10,000 units a week in the test areas.
- Control areas grew 5% over the same period, so expected test sales without the promotion were 10,500 a week.
- Actual sales during the promotion were 15,000 a week. Incremental units: 4,500 a week, or 18,000 over four weeks.
- After the promotion, sales fell to 9,000 a week for two weeks against an expected 10,500. That dip removes 3,000 units.
- Net incremental units: 15,000.
Now the cost. The discount applies to every unit sold during the promotion: 60,000 units at ₦20, or ₦1.2 million. Displays and point-of-sale materials cost a further ₦800,000. Total cost: ₦2.0 million.
The net incremental units earned a gross margin of 15,000 × ₦60, or ₦900,000. The promotion lost ₦1.1 million, even though weekly volume rose 50%. Cost per net incremental unit was about ₦133, more than double the ₦60 margin.
This is why headline volume misleads. Without a control area and a post-promotion check, this campaign would have looked like a success.
A simple evaluation framework
| Measure | How to calculate | What good looks like |
|---|---|---|
| Incremental volume | Promotion area sales minus control area sales | Clearly positive after adjusting for seasonality |
| Cost per incremental unit | Promotion cost divided by incremental units | Below the unit gross margin |
| Trade compliance | Share of audited outlets showing the offer correctly | Above 80% |
| New buyer share | Share of promotion buyers who had not bought in the past three months | Rising, with repeat purchase following |
| Post-promotion dip | Sales after the offer versus the pre-promotion baseline | Small and short |
If the cost per incremental unit is higher than the gross margin, the promotion lost money, whatever the headline volume.
Measuring promotions in open markets and kiosks
Most Nigerian FMCG volume still moves through open markets and small shops with no electronic sales records. That does not make measurement impossible.
- Stock-in, stock-out counts. Count stock in a sample of outlets at the start and end of each week, and record deliveries. The difference gives sales.
- Distributor van records. Van sales reps record orders by outlet. With a little structure, these records become a sell-in panel.
- Short shopper interviews. Two-minute intercepts at market entrances capture what shoppers bought and why.
- Photo audits. Field staff photograph shelves and displays with time and location stamps. This verifies compliance and reduces fieldwork disputes.
Our data collection and surveys service combines these methods into one fieldwork plan.
Nigerian factors to build into the research design
Regional differences. Income, prices and shopping habits differ sharply between Lagos, Kano, Port Harcourt and smaller towns. Choose test and control areas carefully.
Election timing. General elections take place in January 2027. Campaign activity can distort demand in some areas. Avoid evaluating major promotions in the weeks around the vote, or adjust for it.
Security and access. Insecurity in parts of the North-Central and North-East affects fieldwork and supply routes. Plan fieldwork accordingly and document any area substitutions.
Informal trade. Open markets and kiosks rarely have electronic sales data. Retail audits and shopper intercepts fill that gap.
What to report to the board
Boards do not need every chart. They need five numbers for each major promotion: total cost, net incremental units, gross margin earned on those units, return on spend, and trade compliance. Add one line on what you learned and what you will change. Over a year, this record shows which mechanics work for your brand and which to drop. Our competitor analysis work adds a view of how rival promotions affected your results.
Common mistakes
- Judging a promotion by shipments to distributors instead of sell-out.
- Measuring only during the promotion and ignoring the after-effect.
- Assuming the trade passed the offer to shoppers.
- Comparing with last year without adjusting for inflation or price changes.
- Running the same promotion every quarter until shoppers wait for it.
Turn the evidence into next year’s promotion calendar
One evaluation answers one question. A year of evaluations changes how a brand spends. Keep a simple log of every promotion: mechanic, region, channel, cost, net incremental units, return on spend and compliance. After four quarters, patterns appear.
Most brands find that a small number of mechanics deliver most of the return. They also find promotions that never paid back but kept running out of habit. Cut those first.
Use the log to set the 2027 calendar:
- Keep mechanics with proven returns, and schedule them away from competitor peaks.
- Test one new mechanic each quarter in a matched area before rolling it out.
- Shift spend from blanket discounts to targeted trial in regions with low penetration.
- Agree compliance targets with distributors before launch, not after.
A promotion budget built on evidence is easier to defend when finance asks for cuts.
Frequently asked questions
What is promotion effectiveness research?
Research that measures whether a promotion created additional sales and profit, compared with what would have happened without it.
Why are Nigerian FMCG firms spending more on promotions?
Shoppers are buying less as incomes are squeezed, so brands are using promotions to protect volume. Nestlé Nigeria’s promotions rose 64% in the first nine months of 2026.
How do you measure incremental sales?
The most reliable way is to compare sales in areas with the promotion against similar areas without it.
What is trade compliance?
The share of outlets that actually pass the promotion to shoppers as designed.
How long should a promotion evaluation run?
Cover a baseline period before, the promotion itself, and four to six weeks after, to capture any dip.
Can you measure promotions in open markets without sales data?
Yes. Stock counts, distributor van records, shopper intercepts and photo audits give reliable estimates where electronic data does not exist.
Work with Stonehill Research
Stonehill Research & Marketing helps brands understand consumer needs, identify market trends and build strategies backed by data. We design and run promotion evaluations, retail audits, shopper intercepts and consumer tracking across FMCG, banking, healthcare, power, education and digital media. See our market research services.
Discuss your next study: call 0802 320 0801 or 0807 576 5799, or email info@stonehillresearch.com. Visit stonehillresearch.com/contact-us.
Figures are from published company results and press reports as of November 2026.